
The Gantt chart is perhaps one of the most well-known and used charts. Thanks to its reputation, it is certainly versatile and useful for the management of many projects in many different fields. This article will take a closer look at whatit is, what a Gantt chart is for, advantages and disadvantages, and an example.
Whatis a Gantt Chart
The Gantt chart is a very useful tool to represent and graphically visualize the timing and progress of a project.
In fact, it is a horizontal bar chart that gives the whole team an overview of what has been done, how much still needs to be done, who takes care of it and when. Each bar represents a task, while the length of the bars indicates the time it takes to perform thattask.
Its graphical nature makes it easy to understand the flow of work to be carried out and a dynamic diagram allows each member to visualize their responsibilities and the impact of their work on the entire project.
What a Gantt chart is for
A Gantt chart is a Project Management tool that gives guidance on the activities carried out by each team member and the work to be done to achieve the final goal. It helps to divide the project into smaller tasks and monitor dependency relationships between them, ensuring that priorities are respected and preventing the next task from starting if the previous one is not finished. It is very useful both in the initial phase of the process and in the execution phase.
In the initial phase, it facilitates planning by defining the timeline, the dependencies between the tasks to be done, allocating resources and estimating the timing. In the execution phase it gives an overview of the progress of the works and is very useful when multiple projects are developed at the same time. This is because it helps to set realistic timelines, thus ensuring that other projects that require the use of resources in terms of staff and time are not compromised.
But the usefulness of the Gantt chart is not limited to the more operational aspects. In fact, it has a whole series of side benefits. First, it facilitates communication as it updates the entire team on the status of work. This allows you to optimize time by reducing alignment meetings. Then, it incentivizes the team to work more productively to meet deadlines, as everyone is more aware of the impact their work and delays have on the entire project. In general, using a Gantt gives greater flexibility to the entire project, because it allows you to adapt activities and resources to sudden changes that can happen at any time.
Who invented the Gantt chart
The concept behind the Gantt chart was formalized in the early 20th century by American engineer Henry L. Gantt, who developed it as a method for describing production planning and resource loading in factories.
In fact, a very similar concept had already been theorized at the end of the 19th century also in Eastern Europe by the Polish engineer and researcher Karol Adamiecki. In 1996 Adamiecki invented a new way to visualize independent processes in order to improve the visibility of production schedules and in 1931 he published an article describing his diagram, called harmonogram. However, since he had published his works in Polish and Russian, languages little known in the English-speaking world, in the meantime a similar method had been popularized in the West, that of Gantt.
Initially, Gantt charts were more like tables than the charts we’re used to seeing today, and they were hand-drawn and manually revised each time something was changed.
The elements of the Gantt chart
Gantt charts can be used for any type of project, but regardless of the scope, all charts are composed of the following elements:
- Project start and end date.
- Activities that make up the project, represented graphically by horizontal bars that indicate the beginning and end of the project and the assignment of activities to each person on the team working on the project.
- Estimates of expected timelines for each task to ensure that each subtask is completed on schedule.
- Indication of progress to monitor what remains to be done and to be able to complete the project on time.
- Coordination of activities and dependence on each other, since some activities can be carried out at any time, while others are constrained by other activities.
The Disadvantages of the Gantt Chart
When you decide to use a Gantt chart to manage a project, you need to be aware that it requires some commitment and that it may have limits in certain circumstances.
For example, a large project with many team members involved could include hundreds of tasks. As a result, a complex diagram would be obtained whose visualization would be affected and which would require a certain commitment to understanding.
In addition, to work, the diagram must be updated constantly, with precise, detailed and timely corrections that require a certain level of commitment.
Finally, we must not forget that the Gantt chart is really useful only when you have a precise idea of the final result and what needs to be done to achieve it, so the first rule is to have clear objectives.
An example of a Gantt chart
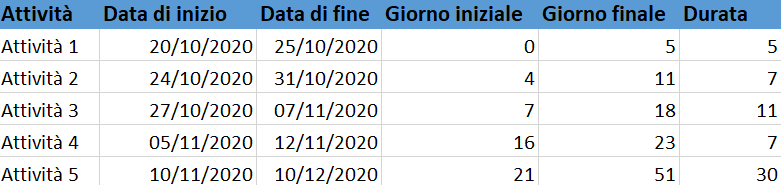
To create a Gantt chart you have to start from the data, starting from a table where you list all the tasks, the start and end dates and consequently the time required to complete the tasks.
In the example table below, the columns show:
- Activities;
- The start date of the activity;
- The end date of the activity;
- The start day of each activity, calculated by subtracting the start date of the activity from the start date of the project;
- The final day of each activity, calculated by subtracting the start date of the first activity from the end date of the activity;
- The duration of each activity, calculated by subtracting the final day from the initial one.
At this point you can create a diagram considering the columns related to: activity, start day and duration. The chart will look like the one below.
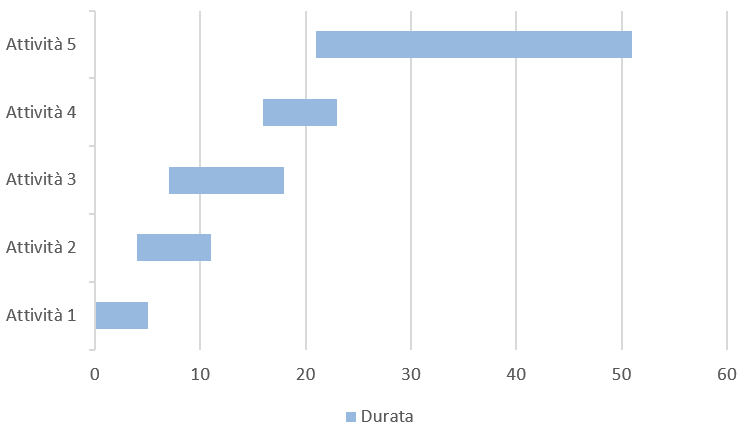 This example was created with Excel which, as mentioned, is often used in these situations. However, even in this simple example it is quite evident how a diagram made in this way presents limits. For example, it is not possible to assign tasks to people, it is not easy to change it, and it does not immediately show the dependence between tasks.
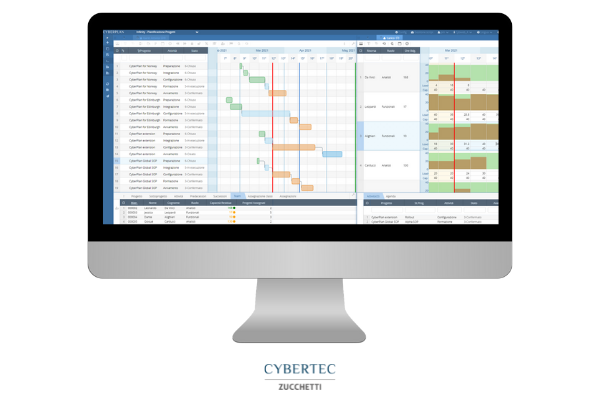
Gantt chart and project planning software
With CyberPlan RSP you can manage projects with all the advantages of a specific software for easy-to-use Project Management. Intuitive graphics, numerous graphs, alarms and KPIs allow you to always be updated on the progress of projects and monitor their progress.
The software works both autonomously and by integrating with the Excel management system or spreadsheets. It helps users involved in the processes to make decisions and plan activities automatically or manually, respecting the precedence and availability of shared resources.
To learn more about CyberPlan RSP, download the brochure.